Wrangler: Interactive Visual Specification of Data Transformation Scripts
abstract
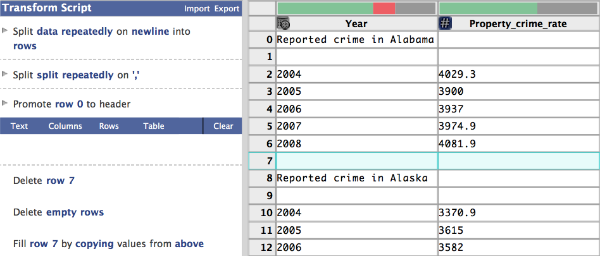
Though data analysis tools continue to improve, analysts still expend an inordinate amount of time and effort manipulating data and assessing data quality issues. Such "data wrangling" regularly involves reformatting data values or layout, correcting erroneous or missing values, and integrating multiple data sources. These transforms are often difficult to specify and difficult to reuse across analysis tasks, teams, and tools. In response, we introduce Wrangler, an interactive system for creating data transformations. Wrangler combines direct manipulation of visualized data with automatic inference of relevant transforms, enabling analysts to iteratively explore the space of applicable operations and preview their effects. Wrangler leverages semantic data types (e.g., geographic locations, dates, classification codes) to aid validation and type conversion. Interactive histories support review, refinement, and annotation of transformation scripts. User study results show that Wrangler significantly reduces specification time and promotes the use of robust, auditable transforms instead of manual editing.
materials and links
citation
ACM Human Factors in Computing Systems (CHI),
2011