Visualization of Heterogeneous Data
abstract
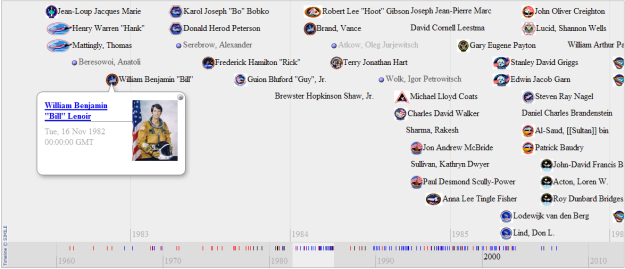
Both the Resource Description Framework (RDF), used in the semantic web, and Maya Viz u-forms represent data as a graph of objects connected by labeled edges. Existing systems for flexible visualization of this kind of data require manual specification of the possible visualization roles for each data attribute. When the schema is large and unfamiliar, this requirement inhibits exploratory visualization by requiring a costly up-front data integration step. To eliminate this step, we propose an automatic technique for mapping data attributes to visualization attributes. We formulate this as a schema matching problem, finding appropriate paths in the data model for each required visualization attribute in a visualization template.
materials and links
citation
IEEE Trans. Visualization & Comp. Graphics (Proc. InfoVis),
13(6),
1200–1207,
2007