IEEE Visual Analytics Science & Technology (VAST),
3–10,
2006
TimeTree: Exploring Time Changing Hierarchies

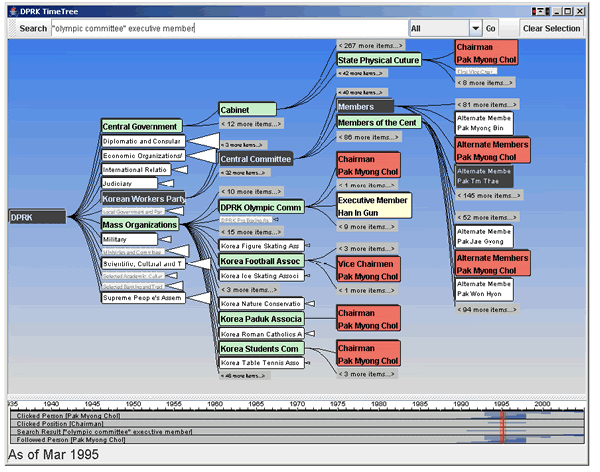
A TimeTree visualization of a dynamic organization chart. Nodes colored in red are those being actively tracked over time. The TimeSlider in the bottom panel allows navigation to a particular time point and provides a visualization of career events.
abstract
Intelligence analysis often involves the task of gathering information about an organization. Knowledge about individuals in an organization and their relationships, often represented as a hierarchical organization chart, is crucial for understanding the organization. However, it is difficult for intelligence analysts to follow all individuals in an organization. Existing hierarchy visualizations have largely focused on the visualization of fixed structures and can not effectively depict the evolution of a hierarchy over time. We introduce TimeTree, a novel visualization tool designed to enable exploration of a changing hierarchy. TimeTree enables analysts to navigate the history of an organization, identify events associated with a specific entity (visualized on a TimeSlider), and explore an aggregate view of an individual's career path (a CareerTree). We demonstrate the utility of TimeTree by investigating a set of scenarios developed by an expert intelligence analyst. The scenarios are evaluated using a real dataset composed of eighteen thousand career events from more than eight thousand individuals. Insights gained from this analysis are presented.
