Computer Graphics Forum (Proc. EuroVis),
32(3),
2013
imMens: Real-time Visual Querying of Big Data

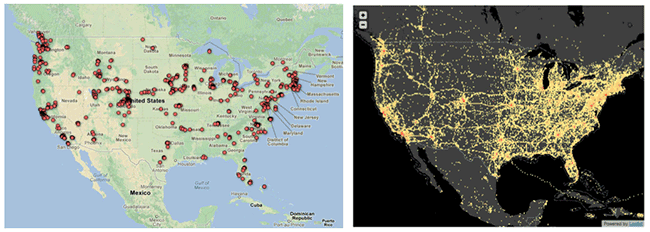
Using Google Fusion Tables (left) and imMens (right) to visualize a dataset of 4M Brightkite user checkins. Fusion Table's symbol map visualizes a sample of the data, while imMens' heatmap shows the density of checkins by aggregation. Compared to the heatmap, sampling misses important structures such as inter-state highway travel and Hurricane Ike, while dense regions still suffer from over-plotting. Moreover, imMens supports real-time brushing and linking among various dimensions of the dataset.
abstract
Data analysts must make sense of increasingly large data sets, sometimes with billions or more records. We present methods for interactive visualization of big data, following the principle that perceptual and interactive scalability should be limited by the chosen resolution of the visualized data, not the number of records. We first describe a design space of scalable visual summaries that use data reduction methods (such as binned aggregation or sampling) to visualize a variety of data types. We then contribute methods for interactive querying (e.g., brushing & linking) among binned plots through a combination of multivariate data tiles and parallel query processing. We implement our techniques in imMens, a browser-based visual analysis system that uses WebGL for data processing and rendering on the GPU. In benchmarks imMens sustains 50 frames-per-second brushing & linking among dozens of visualizations, with invariant performance on data sizes ranging from thousands to billions of records.
